
You just went live with your e-commerce solution hosted in the cloud and started getting some traffic. As times passes, the number of people shopping online on your website increases exponentially. You start noticing some server downtime and visitors are starting to get frustrated with your services. How would you know where the issues are and how to fix them? Enters the observability platform.
In this article, you’ll explore New Relic, one of the leading observability platforms, and learn how to quickly configure it on an ASP.NET Core web app hosted on Microsoft Azure.
The following sections will guide you through getting started with New Relic:
- Understanding what New Relic is
- Understanding what Application Performance Monitoring (APM) is
- Understanding concepts such as Instrumentation and Telemetry
- Understanding the difference between APM and Observability Platform
- Creating an ASP.NET web app on Microsoft Azure
- Signing up for New Relic free account
- Installing New Relic on your web app
- Viewing your web app’s performance with New Relic
- BONUS: Forwarding classic Application Insights logs to New Relic platform
What is New Relic?
New Relic is one of the leading observability platform according to Gartner APM magic quadrant. New Relic offers an observability software platform that aggregates data into logs, metrics, and traces, that can be leveraged by your teams to measure system performance.
Think of measuring system performance beyond the traditional view of CPU, I/O, and memory utilization monitoring. Measuring your system performance involves system health, uptime, bugs, event capturing, error detection, frontend performance and other issues related to the customer experience.
Before you create an ASP.NET web app and setup New Relic instrumentation, you should first understand a few concepts.
Understanding application performance monitoring (APM)
Monitoring means collecting regular data about systems so performance can be viewed and tracked. The goal of monitoring is to quickly know when something goes wrong so it can be resolved before impacting users. The type of monitoring most common today is called application performance monitoring (or APM).
APM solutions gives you both current and historical information about memory usage, CPU utilization, database query performance, web browser rendering performance, app availability, error analysis, external services, and other useful metrics.
With an APM solution, you can find answers to the following questions:
- Are the transactions spending most of the time in the request queue, during different stages of page rendering and execution, or waiting from external services?
- Which transactions are the slowest?
- What relationship is there between a spike in errors or slower throughput for a particular time?
- Was there a deployment or outage?
- What is the path of a request as it travels between services? This is especially useful in large distributed systems.
You’ve might already know some APM solutions available in the market such as Application Insights from Microsoft Azure, Stackdriver APM from Google Cloud Platform, and Amazon CloudWatch from AWS.
Understanding Instrumentation and Telemetry
Telemetry means performance data.
There are four distinct types of telemetry data, summarized by the acronym MELT: Metrics, Events, Logs and Traces.
- An event is a distinct action occurring at a specific moment in time. Using e-commerce solutions as an example, an item being purchased is an event:
At 3:34pm on 12/18/2020 a LEGO™ Star Wars was purchased for 20 dollars. In an hypothetical table, this is how this event would be registered:
| Timestamp | EventType | ItemPurchased | Value |
|---|---|---|---|
| 12/18/2020 15:34:00 | PurchaseEvent | LEGO™ Star Wars | 20.00 |
- From events, you can calculate metrics. A metric is an aggregated number calculated by observing many different events over a given period of time:
For the minute of 3:34-3:35pm on 12/18/2020 there were three purchases totaling $102.75. - Log data represents a step-by-step detail of an event:
12/18/2020 15:33:14: User searches for ‘lego’ keyword
12/18/2020 15:33:17: 12 products for ‘lego’ have been found
12/18/2020 15:33:17: User visits LEGO™ Star Wars product detail
12/18/2020 15:33:17: User adds LEGO™ Star Wars to the shopping cart
12/18/2020 15:33:21: User proceeds to checkout
12/18/2020 15:33:33: User enters credit card information
12/18/2020 15:33:46: Credit card information is valid
12/18/2020 15:34:01: Credit card payment accepted
12/18/2020 15:34:03: Redirecting user to success page- Traces links individual events together to depict the flow of information and activity within the system and its duration. Using trace, you can determine which portion of the transaction is taking so long. A distributed trace for the e-commerce transaction above would look something like this:
| Timestamp | ServiceID | Duration |
|---|---|---|
| 12/18/2020 15:34:23 | e-commerce backend | 5 |
| 12/18/2020 15:34:22 | payments backend | 3 |
| 12/18/2020 15:34:20 | credit card company | 12 |
| 12/18/2020 15:34:19 | shipping backed | 3 |
Knowing what Telemetry is, let’s talk about instrumentation.
Instrumentation is the process of capturing data from your applications, services and environments, and sending it into a monitoring/observability platform.
To help with the instrumentation process you use agents. An agent is a small application which automatically collects data and sends it to a reporting platform.
New Relic have different agents for different parts of your system:
- APM agents for server-side applications such as your ASP .NET Core MVC/API application.
- Browser agents for browser applications. It provides a Real User Monitoring (RUM) solution that measures the speed and performance of your end users as they navigate to your site from different web browsers, devices, operating systems, and networks. The Browser agent is a snippet of JavaScript code which is inserted into each of your HTML pages and reports data to the New Relic platform.
- Mobile agent for mobile applications. It helps you understand performance and crash data.
- Infrastructure agent for hosts that are on-prem or cloud based, services running on those hosts, to containers running in orchestrated environments (K8S, Docker Compose). It also includes forward logs data which allows you to send telemetry data from external APM tools such (e.g. Microsoft Application Insights) to New Relic.
Understanding the difference between APM and Observability Platform
Observability and APM seem very similar at first glance. These two are closely related approaches to understand and improve your software performance, but they don’t mean the same thing.
Both APM and observability use telemetry to collect data across disparate systems. However, Observability involves collecting data across multiple layers of software architecture, analyzing it in real-time, and asking questions about that data, tailored to specific signals—so you know what problems to focus on.
APM provides users with dashboards and alerts to troubleshoot an application’s performance in production. You can monitor the performance of everything including:
- operational dashboards
- real user monitoring
- mobile monitoring
- database monitoring
- infrastructure monitoring
- service maps
Observability gives you deep, technical insights into the state of your entire system. This is especially true in today’s distributed systems. Observability platforms automate collecting data from an array of sources and services together in one place, help you monitor the health of your application by visualizing its performance in context of the entire stack, and then give you the insights to take action.
Observability lets you understand why something is wrong, compared to APM, which simply tells you when something is wrong.
In the next sections, you will create an ASP.NET web app and setup New Relic instrumentation.
Creating an ASP.NET web app
In this section, you will create a sample ASP.NET web app on Azure that you can use for integrating with New Relic.
To create an ASP.NET web application, you need the following requirements:
- An Azure account with an active subscription. You can create an account for free (credit card required).
- Install Visual Studio Code.
- Install Azure CLI.
- Install the .NET SDK (includes runtime and CLI).
Carry out the following steps to create an ASP.NET web app and deploy it on Azure:
1. Open a terminal window on your machine to a working directory. Create a new .NET web app using the dotnet new webapp command, and then change directories into the newly created app:
dotnet new webapp -n AzureWebAppQuickStart --framework net5.0
cd AzureWebAppQuickStart
2. From the same terminal session, run the application locally using the dotnet run command:
dotnet run --urls=https://localhost:50013. Open a web browser and navigate to the app at https://localhost:5001.
4. Sign into your Azure account by using the az login command and following the prompt:
az login5. Deploy the code in your local AzureWebAppQuickStart directory using the `az webapp up` command:
az webapp up --sku F1 --name <app-name> --os-type linuxNote: Replace <app-name> with a name that's unique across all of Azure (valid characters are a-z, 0-9, and -). The --sku F1 argument creates the web app on the Free pricing tier.
The command might take a few minutes to complete. While running, it provides messages about creating the resource group, the App Service plan, and hosting app, configuring logging, then performing ZIP deployment. Then it shows a message with the app's URL:
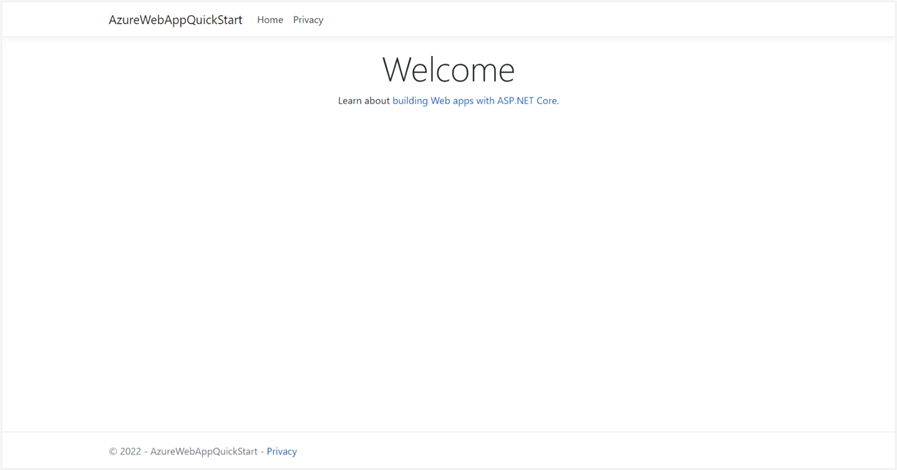
You can launch the app at http://<app-name>.azurewebsites.netOpen a web browser and navigate to the URL. You'll see the ASP.NET Core 6.0 web app displayed in the page.
This quick start was taken from the Microsoft Docs Quickstart: Deploy an ASP.NET web app - Azure App Service.
Signing up for a New Relic free account
You can create a free New Relic account that gives you 100 GB/month of free data ingest. No credit card is required. Carry out the following steps to create a new account:
- Open a web browser and navigate to https://newrelic.com/signup?via=login.
- Enter your name and work email.
- Click on Start Now.
- Check your inbox for an email verification sent by New Relic.
- Once you click the verification link, you’ll be asked to create a strong password.
- Next, choose the region where you store your data and click Save.
- All done! Your account is setup.
Creating New Relic API keys
New Relic monitoring solutions use API keys to authenticate and verify your identity. You can view and manage API keys API keys UI page, which is at one.newrelic.com/launcher/api-keys-ui.api-keys-launcher (from the account dropdown, click API keys).
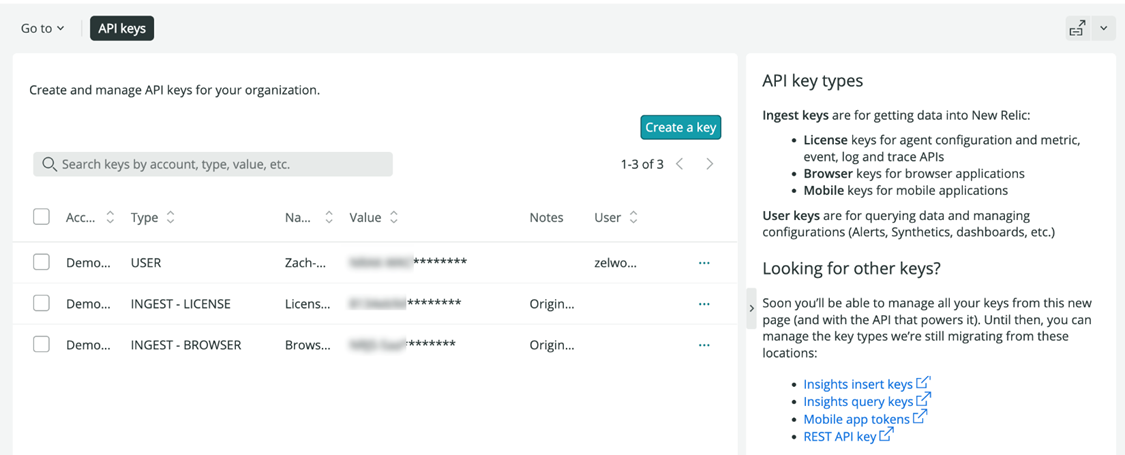
Carry out the following steps to create a new Ingest-License key:
- In the API keys page, click the button Create a key.
- In the right panel, choose the Key type INGEST-LICENSE and the Name “azurewebappquickstart”.
- Click Create a key to confirm the new key creation.
- Click the three dots next to the AzureWebAppQuickStart key and select the option copy ID. Paste this information in a notepad because you are going to need it for the next steps.
Learn more about API keys at New Relic API keys | New Relic Documentation.
Installing New Relic on ASP.NET web app
You will install the New Relic .NET Core agent on your application using NuGet package installation.
New Relic .NET Core agent supports Linux and Windows applications on Azure App Services. The installation process for Azure App Services differs from the .NET Core agent installation procedures for Linux and Windows.
To install the .NET agent on an Azure Web App:
1. Run the following command line to install the NewRelic.Agent NuGet package:
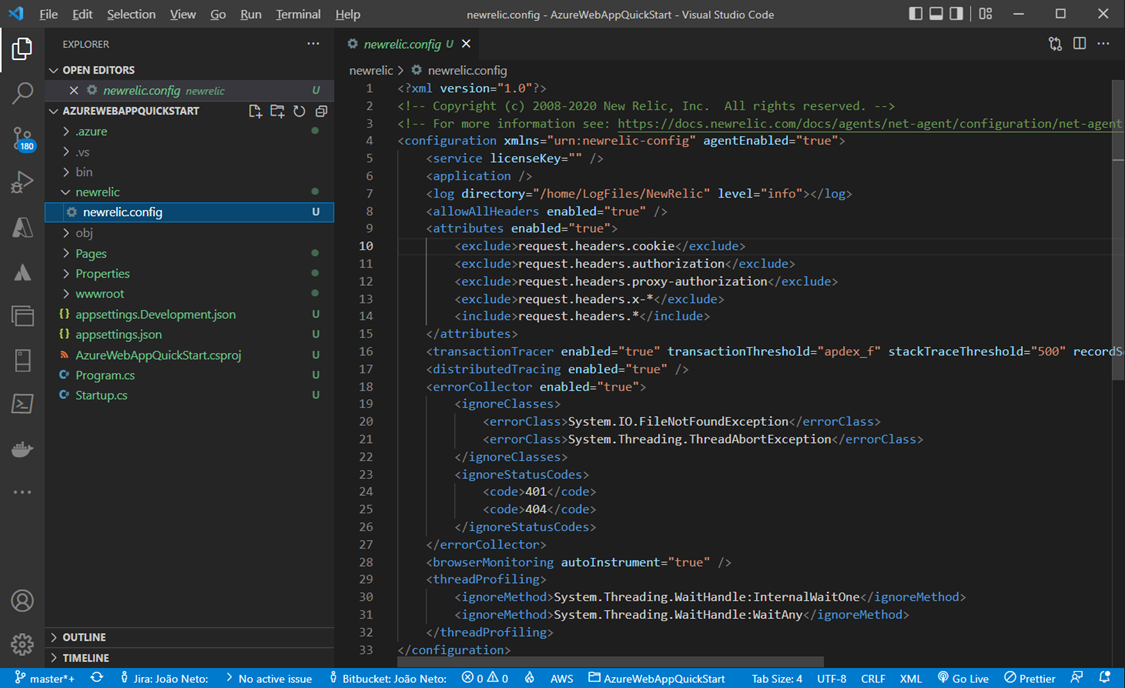
dotnet add package NewRelic.Agent2. Create a folder named newrelic in your solution and copy the file newrelic/newrelic.config from the NuGet package (if you build the project running the command line dotnet build, you will find this file in the /bin/newrelicdirectory).
3. Modify the log node by adding a directory attribute to your copied newrelic.config file:
- For Azure Web App with Windows OS:
<log directory="D:\Home\LogFiles\NewRelic" level="info"></log>. - For Azure Web App with Linux OS:
<log directory="/home/LogFiles/NewRelic" level="info"></log>.
You should have something like this:
4. Publish your application by running the following command line:
az webapp up --os-type linux5. In the Azure portal, open the web app you want to monitor, then select Settings > Configuration.
6. From Configuration, select + New application setting and add the following key/value pairs:
| Key | Value |
| NEW_RELIC_LICENSE_KEY | The API Key you copied in the previous steps. |
| NEW_RELIC_APP_NAME | The name of the API key. E.g., ?azurewebappquickstart?. |
For Azure Web App with Windows OS
| Key | Value |
| CORECLR_ENABLE_PROFILING | 1 |
| CORECLR_PROFILER | {36032161-FFC0-4B61-B559-F6C5D41BAE5A} |
| CORECLR_PROFILER_PATH_32 | D:\Home\site\wwwroot\newrelic\x86\NewRelic.Profiler.dll |
| CORECLR_PROFILER_PATH_64 | D:\Home\site\wwwroot\newrelic\NewRelic.Profiler.dll |
| CORECLR_NEWRELIC_HOME | D:\Home\site\wwwroot\newrelic |
For Azure Web App with Linux OS
| Key | Value |
| CORECLR_ENABLE_PROFILING | 1 |
| CORECLR_PROFILER | {36032161-FFC0-4B61-B559-F6C5D41BAE5A} |
| CORECLR_PROFILER_PATH | /home/site/wwwroot/newrelic/libNewRelicProfiler.so |
| CORECLR_NEWRELIC_HOME | /home/site/wwwroot/newrelic |
| NEWRELIC_PROFILER_LOG_DIRECTORY | /home/LogFiles/NewRelic |
The application settings should look like the following:
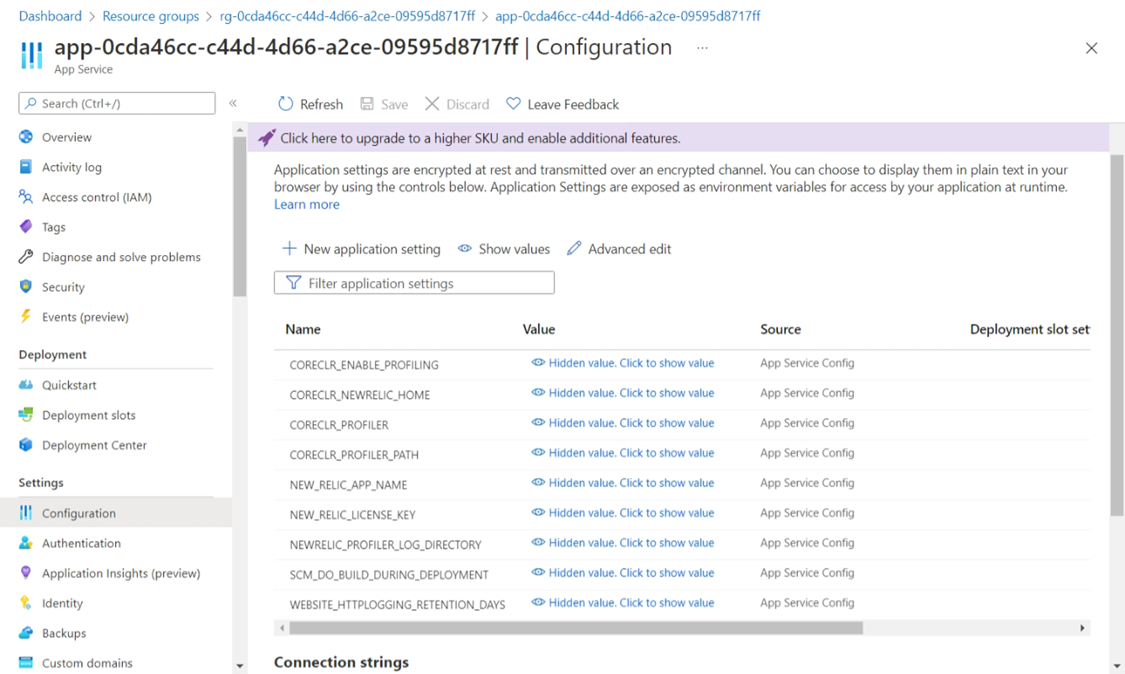
6. Save and restart your web app.
For more information, you can refer to Install the .NET agent on Azure Web Apps | New Relic Documentation.
Viewing your app's performance
Your application must receive traffic for you to view its performance in New Relic. You may need to wait a few minutes for data to start appearing. To view your app's performance in New Relic: Go to one.newrelic.com > APM > (select an app). The APM Summary page automatically appears.
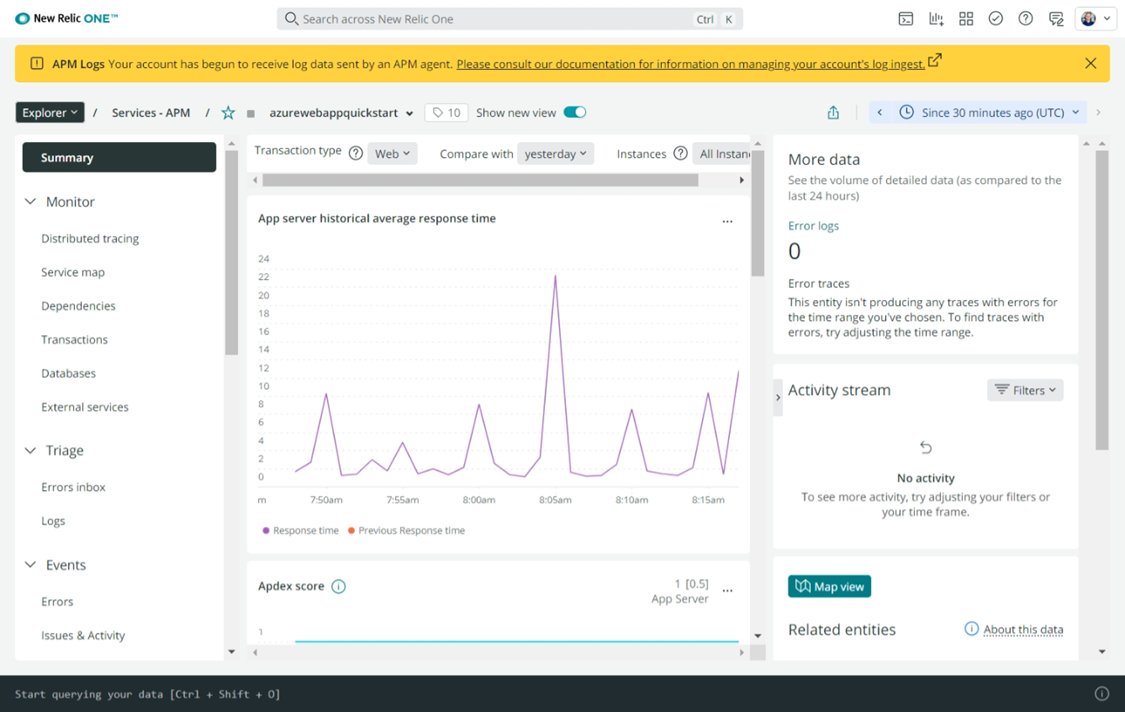
The Data explorer enables you to view and analyses your instrumented data in different chart types, without writing queries. Select the Event type for that source and type of telemetry data and try different Plot and Dimension options.
BONUS: Forwarding classic Application Insights logs to New Relic platform
You can forward Azure logs to New Relic platform. You can achieve this by creating an Azure EventHub or Azure Blob Storage and enabling the continuous export of telemetry to one of these resources. If you want Application Insights logs to be visible on New Relic platform, you must use the Azure Blob Storage option.
New Relic offers you Microsoft Azure Resource Manager (ARM) templates to create the Azure EventHub or Azure Blob Storage resources on your Azure subscription. To deploy the New Relic Blob Storage ARM template, follow these steps:
1. Create a new New Relic API key as described previously.
2. Download the New Relic Blob Storage ARM template into a temporary directory such as C:\Temp.
3. (Optional if you already have an existing Storage Account) Run the following Azure CLI command line to create a new Storage Account:
az storage account create -n {YOUR STORAGE ACCOUNT NAME} -g {EXISTING RESOURCE GROUP} -l westus --sku Standard_LRS --kind StorageV23. (Optional if you already have an existing Storage Container) Run the following Azure CLI command line to create a new Storage Container:
az storage container create --name {YOUR CONTAINER NAME} --account-name {YOUR STORAGE ACCOUNT NAME}4. Run the following Azure CLI command line to deploy the New Relic Blob Storage ARM template into your existing Azure resource group:
az deployment group create --resource-group "{NAME OF AN EXISTING RESOURCE GROUP}" --template-file "C:\Temp\azuredeploy-blobforwarder.json"5. You will be prompted to enter the following values:
- newRelicLicenseKey: this is the license API key you’ve created in the first step.
- targetStorageAccountName: enter the Storage Account name.
- targetContainerName: enter the container name.
6. If everything goes right, you will see 3 new resources created on your azure resource group:
- An Azure Function for exporting logs to New Relic platform.
- A new Azure Storage Account for the Azure Function.
- An app service plan for the Azure Function.
Now, you need to enable the continuous telemetry export from Application Insights into the container you have created in the steps above. Creating a Continuous Export on classic Application Insights from Azure Portal is no longer support, since it will be replaced by workspace-based Application Insights.
To create a Continuous Export on classic Application Insights using Azure CLI, follow these steps:
1. Run the following Azure CLI command line to create a SAS token for the Storage container:
az storage container generate-sas --account-name {STORAGE ACCOUNT NAME} --name {CONTAINER NAME} --permissions w --expiry {date in the format yyyy-mm-dd at a date maximum 7 days from now }2. You should receive a SAS token from the command line above. Below is an example of how a SAS token looks like:
"se=2022-05-14&sp=w&sv=2018-11-09&sr=c&sig=xxxxxxxxxxxxxxxxxxxxxxxxxxxxxxxxxxx" 3. Run the following Azure CLI command line to create a Continuous Export:
az monitor app-insights component continues-export create -g {YOUR RESOURCE GROUP NAME} --app {YOUR APPLICATION INSIGHTS NAME} --record-types Requests Event Exceptions Metrics PageViews --dest-account {YOUR STORAGE ACCOUNT NAME} --dest-container {YOUR STORAGE CONTAINER NAME} --dest-sub-id {YOUR SUBSCRIPTION ID} --dest-sas {SAS TOKEN CREATED IN THE PREVIOUS STEP}Once you've created your export, newly ingested data will begin to flow to Azure Blob storage. Continuous export will only transmit new telemetry that is created/ingested after continuous export was enabled. Any data that existed prior to enabling continuous export will not be exported, and there is no supported way to retroactively export previously created data using continuous export.
There can be a delay of about an hour before data appears in the storage.
For more information, please see Continuous export of telemetry from Application Insights - Azure Monitor | Microsoft Docs and Forward logs and activity logs from Azure | New Relic Documentation.
Troubleshooting
This last section is intended to support you during the process of installing and configuring New Relic. These are the issues that I incurred while writing this article.
Failed to bind to address https://localhost:5001
While running the command line dotnet run –urls:https://localhost:5001, you might see the following error message in the terminal:
Building...
Unhandled exception. System.IO.IOException: Failed to bind to address https://localhost:5001.
 ---> System.AggregateException: One or more errors occurred. (An attempt was made to access a socket in a way forbidden by its access permissions.) (An attempt was made to access a socket in a way forbidden by its access permissions.)
 ---> System.Net.Sockets.SocketException (10013): An attempt was made to access a socket in a way forbidden by its access permissions.
Solution: try using a different port. E.g. dotnet run –urls:https://localhost:5002
Linux Runtime 'aspnet|4.8' is not supported
While running the command line az webapp up --sku F1 --name <app-name> --os-type linux, you might see the following error message in the terminal:
The webapp 'app-3294f3fd-db33-422b-b216-7a97ddfa1166' doesn't exist
Creating AppServicePlan 'amancio.joao87_asp_Linux_centralus_0' ...
Creating webapp 'app-3294f3fd-db33-422b-b216-7a97ddfa1166' ...
Linux Runtime 'aspnet|4.8' is not supported. Please invoke 'az webapp list-runtimes --linux' to cross check
As of the time of writing this article, .NET Core 6 is not supported on Linux. You can check the supported runtimes on Linux by running the following command line az webapp list-runtimes --linux.
Solution: delete and scaffold a new solution by running the command line dotnet new webapp -n AzureWebAppQuickStart --framework net5.0.
Summary
In this article, you learned how to create a simple ASP.NET web app on Microsoft Azure and install New Relic observability platform. You also learned key concepts such as what Application Performance Monitoring (APM) is, Instrumentation and Telemetry and the difference between APM and Observability Platform.
With the new skills learned in this article, you can start monitoring the performance of your applications and troubleshooting issues by using New Relic’s observability platform.
